Bildung

visualpkm

Overview of a presentation with many illustrations, arranged as a mindmap.

Last Friday was makesensemess 2022. Two hours of online geekery around the use and usefulness of diagrams as a sensemaking tool. All speakers chose to talk about such personal and heartfelt topics. Heartwarming and inspiring. Thank you Abby for putting it all together which such great care.

Thank you everybody for your attention and nice words about my bit.

Here's my presentation with notes (big file, will take some time to load).

Some answers to questions in the chat: – Mindmapping & presentation tool: xmind – Fountain pen: Lamy Safari, F nib, in the color Umbra because those have a somewhat textured body for better feel and grip – Yes you can buy Lego bird prints here :)

_ #presentation #makesensemess #creativejournal #visualpkm #diagrams

This coming Friday November 4th I'll deliver a short presentation at makesensemess 2022, “an Annual Celebration of Sensemaking”. Makesensemess is organised by Abby Covert, information architect and author of STUCK? diagrams help.

This edition will be a celebration of the many different ways a diagram can help. Although I have plenty examples of diagrams that came in useful during client work, I chose an example from my own creative practice. I'll discuss how a simple diagram helped me better understand what I had been working on up till then and at the same time clarified what I could explore next.

Check out the programme and maybe see you there?

_ #visualpkm #creativejournal #diagrams #presentation

See #worldsketchnotingday

I don't often find myself adding pictural elements to notes I take when reading. When I do, it's mostly simple arrows, boxes or other diagrammatic marks to indicate relative importance and relationships. For example, these are notes I took working through this video on conceptual models. (Which are another kind of sense-making visualisations in themselves, but not now, not now.)

Handwritten notes on lined A5 paper, an orange colored sticky note with key words covers the top left part of the paper.

For me, the most natural situation for making sketchnotes is while listening to a talk or presentation in a conference setting (remember those? etc.). Other than with video's and podcasts, you can't really pause or rewind the speaker and that in itself forces you to pay attention.

At the same time, the speed of delivery is slow enough to keep up with with drawing and writing.

Looking back at some of the drawings I made that could be called sketchnotes, it's clear I don't aim for a complete and linear summary of all that was presented.

Sketchnotes from the Backend of Frontend by Marc van Gend, presented at Drupaljam 2014 in the Netherlands.

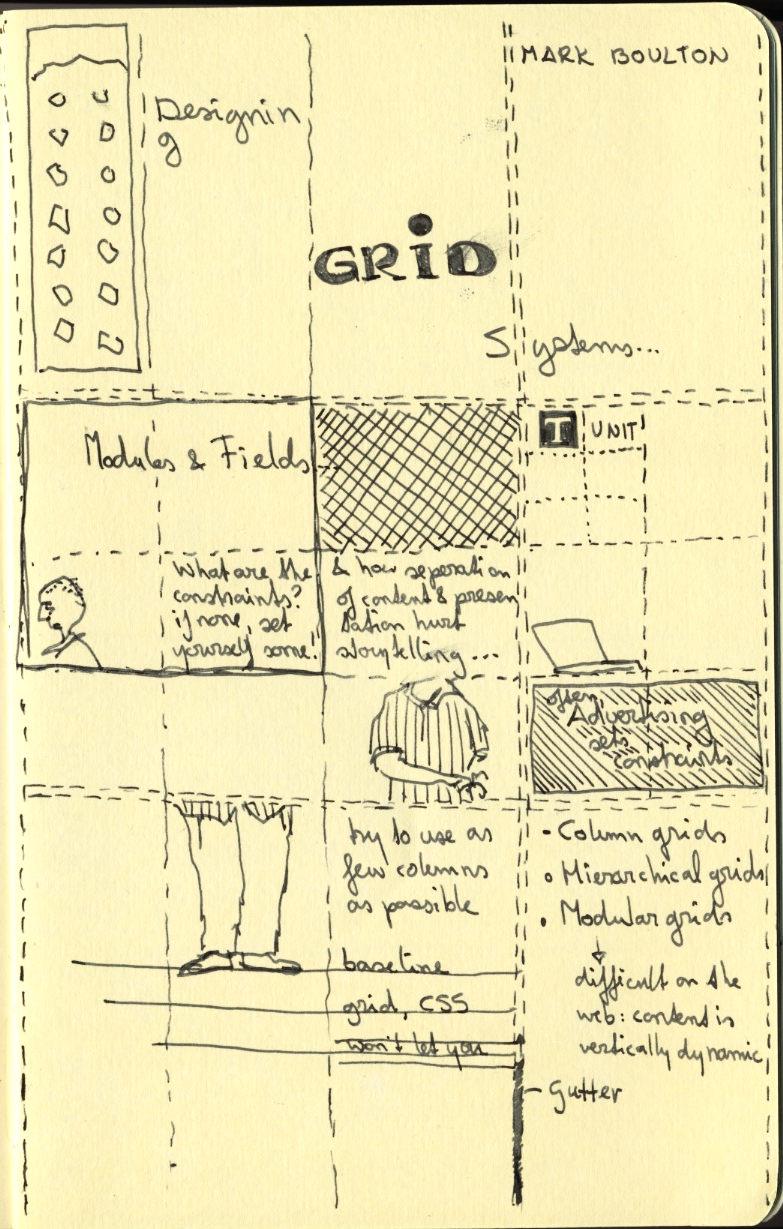
I often start with drawing elements of the actual environment: speaker, audience, details of the architecture. This way of drawing has more to do with concentration, it doesn't seem to interfere with listening. A more observational version of 'doodling while on a call'. It can make for interesting contrasts between image and text.

Drawing of a speaker behind a podium in a baroque-ish room with a large chandelier hanging from the ceiling.

These drawings then mix visual impressions of the real-life scene with the core ideas being discussed. In the more succesful ones that combination of elements communicates the argument being presented by the speaker.

Sketchnotes from a 'designing grid systems' presentation by Mark Boulton.

In cases where I made sketchnotes during multiple, related talks I sometimes scan the individual drawings and created a digital collage to bring the main points and observations together. The monochrome line art of the drawings and text provide a lot of room for interesting connections and overlaps.

A collage made from multiple scanned drawings and notes taking during a week long summer school programme on the topic of heritage collections.

Find these and some more sketchnotey drawings here.

#sketchnotes #visualpkm

11/365